How a Dendrogram Helps You Work More Efficiently
Say what? If the term “dendrogram” is foreign to you, don’t worry. It’s actually just a fancy name for a type of diagram you probably encountered in elementary school. And it’s part of a powerful feature in the ProDemand auto repair information that helps with diagnosing multiple trouble codes. Let me explain…
Back in your early days of school, you probably remember being given a page that had two lists going down opposite sides of the page. The task was for you to relate each item in the left-hand column to an item in the right-hand column. This was your first introduction to a relational graph, or more technically, a dendrogram. You may also know this as a tree diagram.
It’s a very simple way to present the relationship between one thing to another, or even one thing to many things. That is how ProDemand uses the dendrogram to show relationships between DTCs and components or Symptoms and components in the Causes & Fixes card in 1Search™ Plus (or the ProView tab in 1Search Classic).
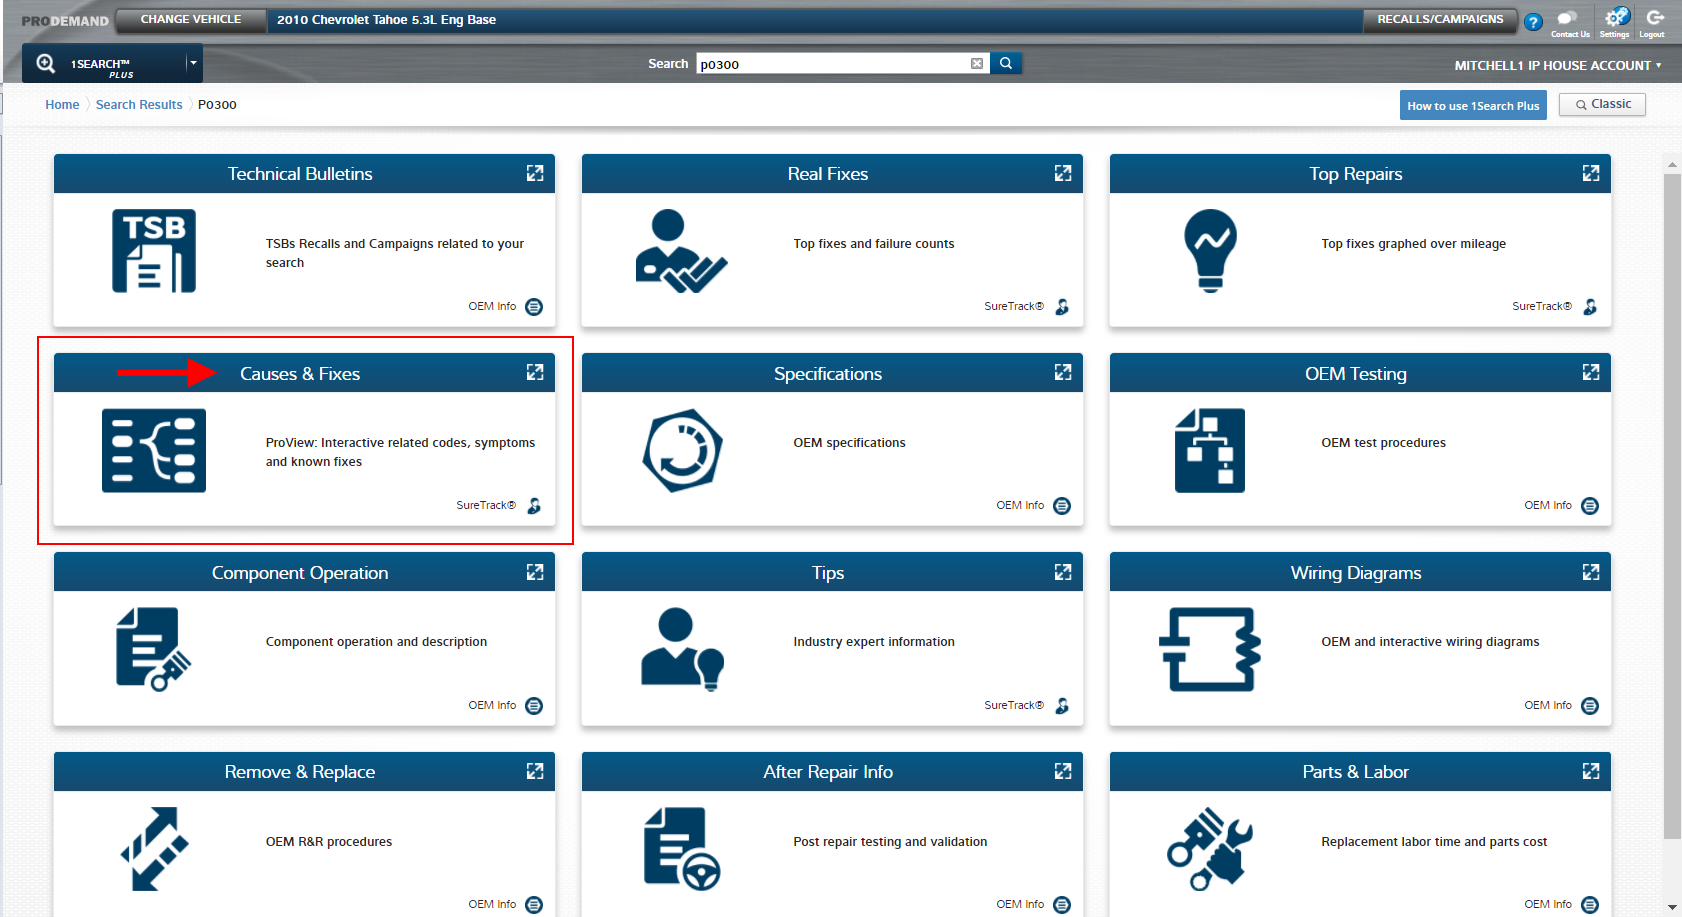
The example below shows just how valuable arranging the data like this can be. First, navigate to the Causes & Fixes card:

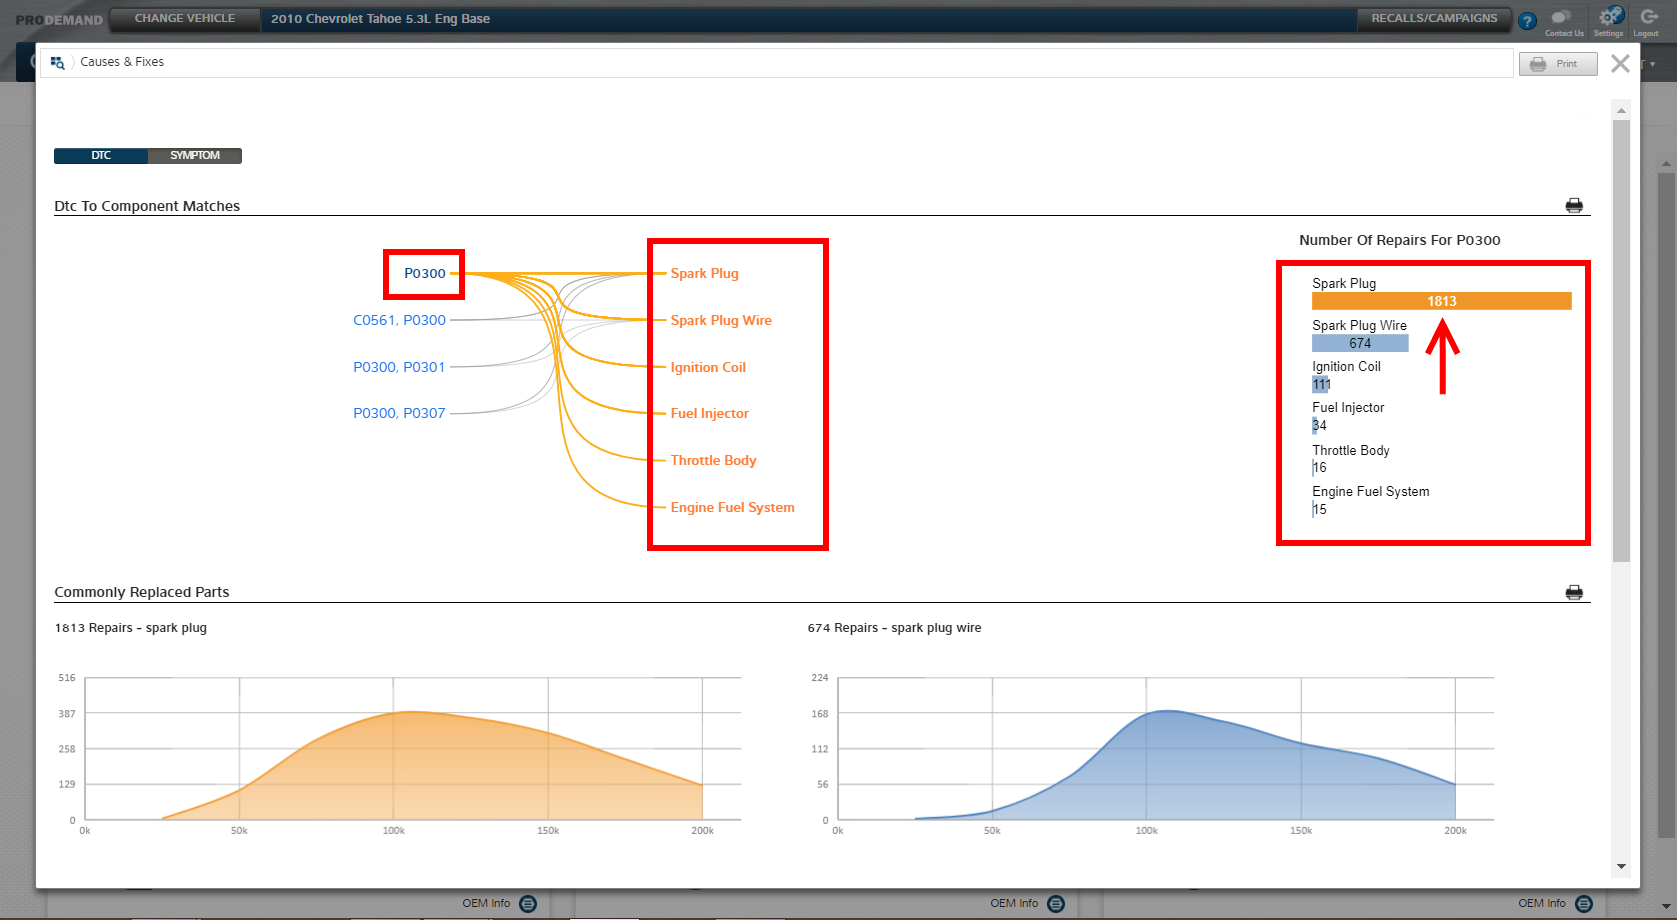
You will be presented with a dendrogram (see below). We all know that any number of components can cause a misfire. In this case — a 2010 Chevrolet Tahoe with a PO300— the graph shows six possibilities. This list even suggests that the most common cause is a spark plug (in 1,813 verified instances).
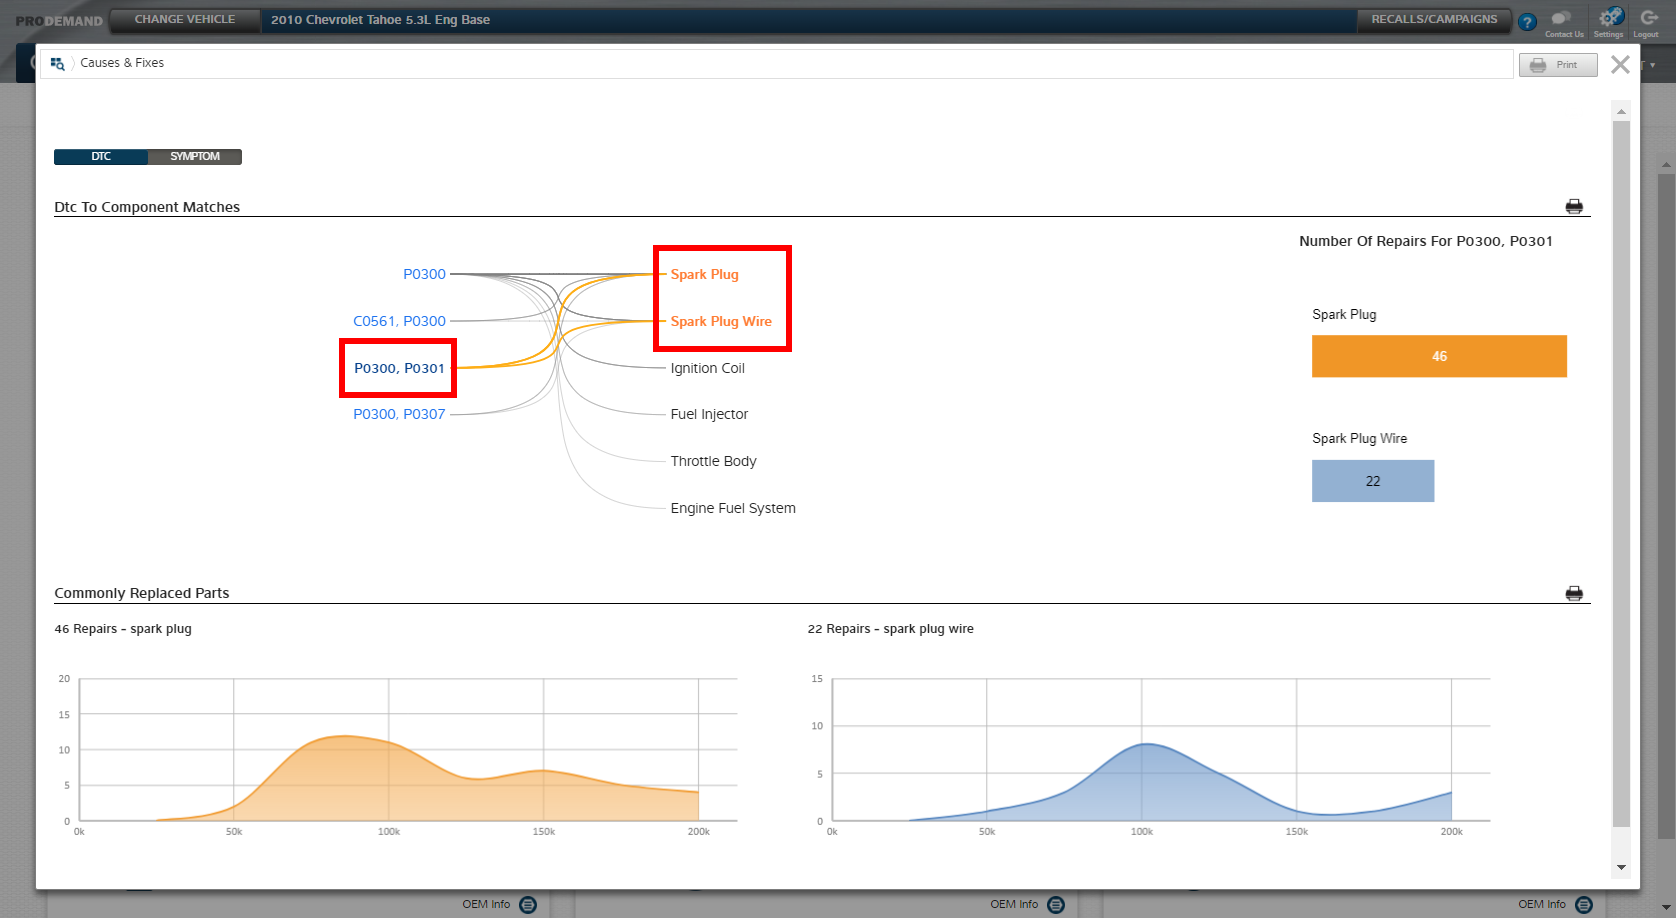
But when you pulled the codes on the truck you had both a P0300 and a P0301. By selecting that combination from the graph you narrow things down even more — to spark plug and spark plug wire (see below).
In just a few minutes, and without a great deal of effort, you have diagnosed the vehicle to a point where you know what you’ll check next. Bet you never thought a childhood flashback would help you fix a car!
Read more about 1Search Plus:
Here’s How 1Search Plus Helps Techs Work More Efficiently
Getting Started with 1Search Plus


