Top 5 Ways to Use the Common Repair Procedures Graph
This post answers questions related to the Common Repair Procedures Graph in ProDemand, and gives you the Top 5 Ways to use the graph more effectively for diagnostics in your auto repair shop.
 1) Where does the information for the Common Repair Procedures Graph come from?
All of the information used for the Common Repair Procedures Graphs comes from real aftermarket repair orders. Mitchell 1 has a database of hundreds of millions of repair orders that we use to connect code/symptom data with parts and mileage data. Not only that, but all of the information is specific to the selected vehicle so every data point is relevant to the vehicle in your bay
Another important point is that Mitchell 1 is used almost exclusively by professional technicians, so the repair information for the Common Repair Procedures Graph shows the real parts that other professional technicians use to repair the vehicle. The Common Repair Procedures Graph is a true picture of what is happening in the aftermarket, not a hypothetical scenario.
2) How do I use this information as part of a diagnosis?
You should be looking to build a diagnostic strategy and the Common Repair Procedures Graph allows you to prioritize the order in which you will diagnose your problem. Start at the top of the list by testing the most likely components for failure, saving you diagnostic time by learning from what other professional technicians with a similar code/symptom have already determined.
The Common Repair Procedures Graph is not meant to be a parts-swapping checklist. Instead, the Common Repair Procedures Graph provides clues that can help you to diagnose the code or symptom which brought the vehicle into the shop. You have to take the information given to you in the Common Repair Procedures Graph together with your experience and common sense to build your diagnostic test strategy.
3) How do I read the Common Repair Procedures Graph?
Let’s break the Common Repair Procedures Graph down into its components:
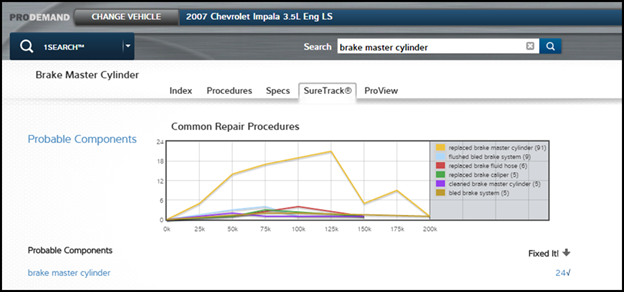
Horizontal axis = mileage. This axis tells you the mileage on the vehicle when that repair order was written. Take a look at the odometer of the vehicle in your bay, and pay particular attention to that mileage in the graph.
Vertical axis = counts. This is the number of times we’ve seen an instance. The highest line along the vertical axis will be the part most frequently replaced by professional technicians with similar symptoms.
On the right side of the graph is a list which gives the total Common Repair Procedures instances without regards to mileage. This list is a good way to take a quick glance at what the most likely failed component are.

4) Can I view just one component on the Common Repair Procedures Graph?
Yes. On the right hand side of the Common Repair Procedures Graph, click on one of the items to make it disappear/reappear on the graph. You can use this feature to simplify the graph in order to make it easier to read.
5) How can I use the Common Repair Procedures Graph to increase my sales?
The graph allows you to look forward and see problems that may occur with this vehicle. Let’s take a personal example – my 2007 Chevy Impala with 90,000 miles. My brakes started getting awfully soft, but something that occurred gradually, so a typical driver might not even notice. If you look at the Common Repair Procedures Graph, you can see that the Brake Master Cylinder is actually a pretty common part to be replaced on this vehicle. It might lead you to ask the question of any customer with an Impala, “Have you noticed that your brakes have become really soft?” and also make sure the brake system is inspected by the technician for a possible upsell.